
Rainfall, rivers, aquifers and usable water resources in Italy
In terms of rainfall, water in Italy in an average year is decidedly abundant: 296 billion cubic meters, which, net of evaporation, form 155 billion cubic meters of surface runoff (watercourses) and 13 billion cubic meters of underground resources. According to the Water Research Institute (Istituto di Ricerca sulle Acque – IRSA) [1], the total of “renewable” resources (which are renewed every year) would amount to 168 billion cubic meters [2], which correspond to about 2,800 cubic meters per inhabitant, a figure higher than countries such as Great Britain or Germany.
read also “Domestic water consumption and solutions to reduce it“
However, not all surface and underground outflows are usable: if we exclude the Alpine basins, most of the rainfall occurs in the period from October to March. To use this outflow during the course of the year – and in particular in the summer period when irrigation uses are concentrated – “regulation” volumes are needed which allow water to be accumulated when the flows are abundant and to be used in the dry season. According to IRSA, thanks to the regulating capacity of the reservoirs built or under construction in Italy, at the beginning of 2000 the resources available from surface outflows amounted to approximately 40 billion cubic meters, plus 12 billion cubic meters of groundwater [3].
The territorial distribution of the available resources is shown in the following table, which shows how the Po basin and the North East basins (Adige, Brenta, Tagliamento, Isonzo, as well as some minor basins) are the areas where most of the availability of resources is concentrated. In the South, the territories with the greatest available resources are Abruzzo-Molise and Calabria-Lucania. But perhaps the most interesting datum is that of per capita availability, from which it emerges that various Southern regions have much higher water availability than the central regions and Liguria: in addition to the rich water system of Abruzzo-Molise (with availability approaching 2,000 m3/inhabitant/year, higher endowment than the Po valley regions) also Calabria/Lucania and Sardinia, thanks to the remarkable ability to regulate the reservoirs and the low population, have a water endowment higher than the national average. Puglia, Campania and Sicily, on the other hand, have an availability of resources lower than 500 m3/inhabitant/year, similarly to Tuscany and the regions of the Tiber Basin.
| Compartimento | Risorse disponibili (milioni di m3/anno) | Risorse disponibili pro/capite
(m3/abitante/anno) |
| Bacino del Po | 20.586 | 1.334 |
| Nord Est | 12.660 | 1.975 |
| Liguria | 679 | 377 |
| Romagna-Marche | 1.615 | 478 |
| Toscana | 983 | 275 |
| Lazio-Umbria | 2.525 | 437 |
| Abruzzo-Molise | 2.702 | 1.755 |
| Puglia | 848 | 220 |
| Campania | 2.166 | 400 |
| Calabria-Lucania | 3.109 | 1.180 |
| Sicilia | 1.889 | 388 |
| Sardegna | 2.058 | 1.298 |
| Italia | 51.819 | 921 |
Available water resources in Italy, by hydrographic compartment (Source: Irsa-CNR 1999)
The situation described in the table above does not provide a picture of the real availability of resources in the area, because it does not take into account the transfer of resources between hydrographic compartments. The hydraulic works carried out in recent decades have made it possible not only to regulate the outflow, thus increasing availability, but also a redistribution of resources: Puglia, for example, one of the poorest regions in water, can count on huge transfers from Lucania.
The data reported tell us, in a nutshell, that even the water-poor Italian regions can count on a per capita water availability of at least 400 m3 per year, a value that is not very high but at least 10 times higher than in neighboring countries, such as those on the southern shores of the Mediterranean.
read also “Domestic water consumption and solutions to reduce it“
Water consumption in Italy
As with availability, data relating to water withdrawals and consumption are also largely based on estimates and not on measurements of the volumes actually withdrawn and consumed. In fact, although for some time now (Legislative Decree 152/99), the obligation has been introduced for holders of concessions for the derivation of surface water or the extraction of groundwater, to measure the actual flow rates withdrawn, this rule is still largely unapplied. The only sector for which reliable data is available is the civil one, where consumption is actually measured by managers and the national picture is periodically updated thanks to surveys carried out by ISTAT.
The mystery of irrigation consumption in Italy
The annual volumes of water used in agriculture is one of the deepest mysteries of environmental analysis in our country. The first estimates of irrigation consumption in Italy date back to the National Water Conference held in Rome in 1969. The conference proceedings estimated national irrigation withdrawals in the order of 25 billion cubic meters per year, a figure confirmed in 1989, when the estimates of the Water Conference were updated.
In 1999, the CNR Water Research Institute (IRSA CNR) revised the estimate of national irrigation withdrawals to about 20 billion cubic meters per year. This correction was based on assessments of a different nature, but above all it started from the observation that “a stable reduction of the irrigated area and a reduction of the unitary needs” was underway: the irrigated area at national level, which grew continuously until 1990, when it reached almost 2,900,000 hectares, then decreased significantly: in 2010 – the last available year of the Agriculture census – the irrigated surface is estimated at 2.42 million hectares.
At the beginning of the new millennium, therefore, estimates of irrigation withdrawals were around 20 billion cubic meters per year (see table below).
Tabella 1 – Water withdrawals in Italy in 1999 (millions of m3/year)
| Civili | Industriali | Irrigui | Energia | Totale | |
| Nord Ovest | 2.268 | 3.520 | 8.193 | 1.863 | 15.844 |
| Nord Est | 1.453 | 1.648 | 5.277 | 2.538 | 10.915 |
| Centro | 1.618 | 1.482 | 970 | 72 | 4.142 |
| Sud | 1.803 | 879 | 3.506 | 36 | 6.223 |
| Isole | 798 | 457 | 2.191 | – | 3.447 |
| Italia | 7.940 | 7.986 | 20.136 | 4.509 | 40.571 |
Source: IRSA-CNR A future for water in Italy. Draft for discussion during the IRSA-30 years conference. Rome 24 June 1999
In 2015, the Po River Basin Authority in the strategic environmental assessment that accompanies its Management Plan wrote: “from the estimates made through simulations and from the analysis of the water crises that have recently occurred, it emerged that if the natural availability drops, annually, considerably below 18 billion m3, the agricultural system begins to sustain impacts which, in the face of increasingly substantial reductions, can generate real crises in the sector and conflicts for the use of the resource with economic costs and damages that are borne by any of the productive, social or environmental components”. If the Po basin alone has to withdraw 18 billion cubic meters per year for irrigation to avoid crises in the agricultural system, it is clear that the hypothesis of 20 billion per year on a national scale is largely underestimated and a credible estimate would be around 30 billion cubic meters per year, even higher than the first estimate made in 1969, which is moreover reasonable, considering the significant growth in the irrigated area from 1970 to today.
But the uncertainty about the numbers doesn’t end there. Today, the ISTAT website which makes data from the 2010 Agricultural Census available (http://dati-censimentoagricoltura.istat.it), claims that less than 11.1 billion cubic meters are used annually to irrigate the nation’s 2.42 million hectares of irrigated land: in practice, 50 years after the National Water Conference, we still don’t know whether we need 10 or 30 billion cubic meters to irrigate Italian agricultural production!
read also “Domestic water consumption and solutions to reduce it“
Industrial and energy consumption
As for consumption for industrial use, even in the absence of certain data for the Italian national territory, there is a shared opinion that also in Italy, as in the rest of Europe [4], there is a progressive reduction in water consumption in the sector, due both to the improvement of technologies, and to the relocation abroad of the most water-demanding industrial production. This trend suggests that industrial consumption today is now less than the 8 billion cubic meters/year estimated by the IRSA Report, with a tendency towards further contraction.
The value of 4.5 billion cubic meters/year intended for energy use is based on a very rough estimate, in any case any errors, even substantial ones, would not significantly change the overall picture.
Civilian consumption
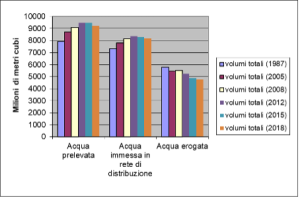
The data on civilian consumption shown in the Table above is that contained in the 1999 IRSA report, referring to the 1990s. The ISTAT updates, available today up to 2018, allow for some observations on the most recent trends.
 |
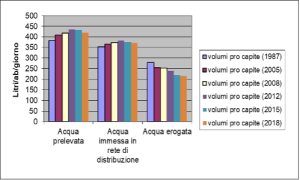 |
| Valori assoluti | Valori pro capite |
Withdrawals and consumption for civil use in Italy. Source: based on Istat data
The continuous growth of water withdrawals, which had been going on for decades, finally stopped in 2015, but water consumption (the water supplied, therefore actually used) began to decrease already at the end of the last century. Nevertheless, drinking water consumption for civil use in Italy remains the highest in Europe.
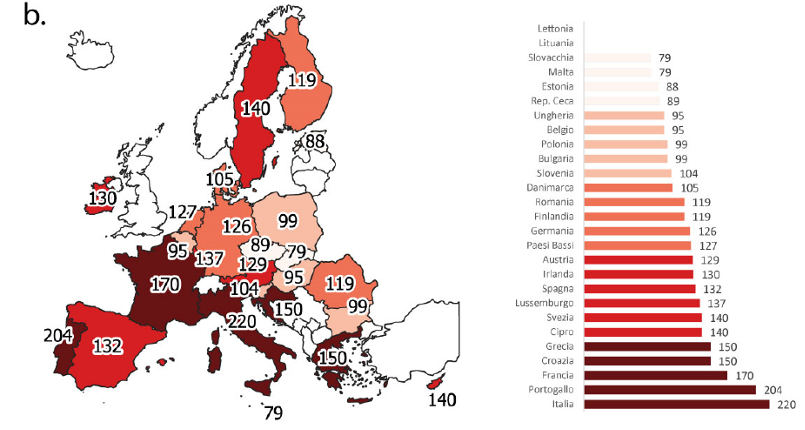 Consumption for civil use in Europe. Source: UTILITATIS Foundation. Blue Book 2022
Furthermore, the difference between water withdrawn and water supplied is still very high: the so-called “losses” which still make up around 40% of resources. In any case, the difference between water withdrawn and supplied includes both losses or overflows from the distribution network (actual losses), and abusive withdrawals and errors in measuring instruments and accounting (apparent losses); the latter represent no more than 5% and are often around 3%. The greatest total dispersions and network dispersions of drinking water are recorded in the southern regions, where to dispense 100 litres of water it is necessary to withdraw almost 200.
From the data reported, the Italian situation would seem to be in order: with around 52 billion cubic meters of available resources per year and an annual consumption of around 40 billion cubic metres, we are able to guarantee the needs with a substantial margin of 12 billion cubic meters per year. No problem then? Unfortunately, as we will see in the next paragraph, this is not the case. If the withdrawal of 40 billion cubic meters seems theoretically compatible with an availability of 52, it is not equally compatible with the quality of the waters of our rivers and aquifers. In other words, the estimate of usable resources does not take into account the need to maintain a “natural water circulation”: in critical seasons, the flow rates of our rivers and aquifers tend to be almost completely exploited and there is not sufficient natural outflow, not only to keep the ecosystem alive – in the case of watercourses – but not even to dilute the pollutants which, even if treated by treatment systems, it is necessary to discharge.
Why it is important to reduce civilian consumption
But if in countries with a Mediterranean climate like Italy a large part of the consumption of water resources is due to irrigation, why is it important to reduce civil consumption? First of all because water for civil uses represents a minor share of water consumption – in Italy and in other countries that use a lot of water for irrigation it is about 20% – but it is the one that requires the best quality, qualities that generally only groundwater or spring water have, and also entails higher costs for supply, management and treatment.
But there is another important reason to rationalize the consumption of drinking water: the water used in our homes is often still the main cause of pollution of rivers and groundwater, even when we manage to pass it through a treatment plant before discharging it. Since the 1960s, important infrastructure plans for the treatment of waste water have been launched in all Western countries: today, in these countries, high percentages (generally above 70% with peaks close to 100%) of population are connected to the sewage system and served by a treatment plant. This has allowed a significant reduction in pollution, but has not solved the problems definitively: for many reasons, our rivers and groundwater remain polluted, sometimes at levels that make their waters practically unusable, in addition to the obvious repercussions on the quality of the ecosystems that receive the pollutants. Reducing the consumption of drinking water means reducing the discharges of treated water and – with the same concentration of discharges – reducing the polluting load towards surface waters.
In short, the fact that in Italy we consume so much drinking water not only reduces the possibility of allocating this water to other uses or releasing it to its natural circulation, but also contributes to the pollution of rivers and aquifers.
Effects of climate change on water
Climate change is already causing changes in the timing and location of rainfall. In many regions of the world rainfall is becoming more variable and more uncertain, leading to more frequent and more intense floods and droughts. Also in Italy, where with a temperature increase of up to 2°C in the period 2021-2050, there will be a decrease in summer rainfall in the Centre and South and an increase in events linked to intense rainfall in the North. What will be the consequences on water resources? According to the Euro-Mediterranean Centre Foundation on climate change (Centro Euro-Mediterraneo sui Cambiamenti Climatici – CMCC), for urban areas, with the exception of some areas of Veneto and Tuscany and the Alpine areas, the reduction in rainfall will lead to more frequent situations of drought and water scarcity. “Southern Italy will particularly suffer from a reduction in the performance of water basins. It has been seen that the main cause of the insufficiency of the systems in Southern Italy is linked to the reduction of available rainfall rather than to the capacity of the reservoir, the main problem instead for the systems analysed in Central Italy”, reads the 2020 CMCC Report. The impact of the climate will change the life of Italian cities: Naples, Bologna, Milan and Rome show a growing trend in the number of very hot days. In some areas of Italy, there is an increase in the maximum precipitation, in the period from November to March. Cities that fail to take steps to safeguard their water supply could have major repercussions.
Notes
[1] IRSA-CNR A future for water in Italy. Document drawn up for the IRSA-30 years conference. Rome 24 June 1999. The IRSA 1999 report still constitutes the most recent information framework on availability and consumption, with the exception of the civil sector for which – as we will see – more recent ISTAT data are available.
[2] The IRSA figure is slightly lower than that provided by other sources: e.g. Massarutto in the chapter dedicated to Italy in “Water policies in Europe” (Edited by B.Barraqué. Franco Angeli 1999) provides a figure of 187 billion cubic meters, while the UNEP database (http://geodata.grid. unep.ch/results.php) speaks of 191.3 billion cubic metres. However, these are estimates that do not differ much from each other.
[3] Groundwater is in fact “naturally” regulated by aquifers which act as large reservoirs, so it is possible to exploit almost all of it (12 out of 13 billion cubic meters which make up the total groundwater resources).
[4] The trend towards a reduction in industrial water consumption across Europe is confirmed by the 1990 – 2005 comparison of data from the European Environment Agency (EEA, Core Set Indicator CSI 18, based on data from Eurostat data table: Annual water abstraction by source and by sector).
read also “Domestic water consumption and solutions to reduce it“